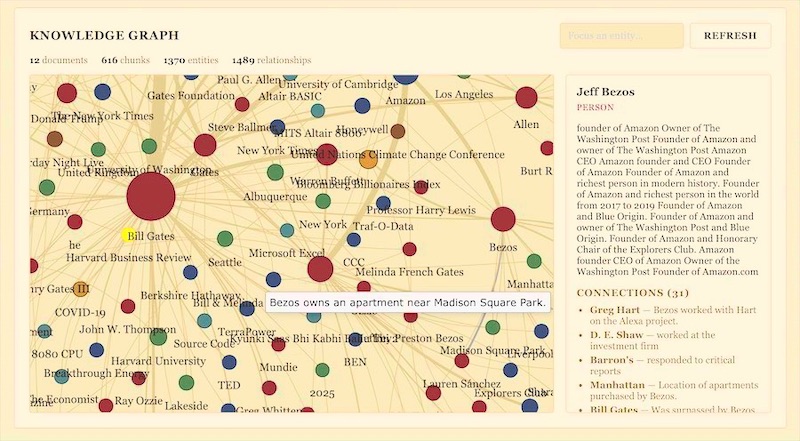
Imagine you went to the library to get some information on Egypt. You can ask the librarian to get you all books related to Egypt. From a librarian perspective without knowledge of Egypt, he can get you all books where the title has Egypt. Now imagine a librarian who is educated enough to get all related books to what you wanted. For example, he will know that books referencing pharaohs, pyramids, hieroglyphics or river Nile to name a few would possibly be referencing Egypt. So, he can get you a much larger set of books. This is the difference between RAG (Retrieval Augmented Generation) and GraphRAG. The later has a cross-reference of knowledge eventually creating a graph of all things it knows.
What is GraphRAG
GraphRAG is a framework that extends traditional RAG by building a knowledge graph from the retrieved chunks and then using that graph to guide the language model’s generation.
- Retrieval will pull relevant texts
- Graph construction links the chunks together
- Generation happens on top of the graph, allowing the model to “reason” over the network of facts instead of a flat list
In practice, we have a graph where the nodes are all entities and the edges are relationships between two entities. Given this graph a model can walk the graph and produce an answer that is both grounded and well-structured.
Difference from ordinary RAG
| Aspect | Ordinary RAG | GraphRAG |
| Data Representation | Flat list of data | Interconnected entities and relationships |
| Context Depth | Limited to nearby text | Can do graph based reasoning |
| Explainability | Difficult to trace | Graph path can be easily visualized |
| Relationship Reasoning | Struggles with “how does X relate to Y” questions | Excels at relationship-based queries |
| Hallucination Risk | Higher, as connections are implicit | Lower, as all relationships are explicit |
| Relationship Scalability | Limited to token size | Graph can capture arbitrarily more data |
| Setup Complexity | Simple and fast to implement | Requires more upfront work to structure data |
| Query Performance | Very fast on simple lookups | Fast on complex relationship queries once indexed |
| Best For | Simple fact retrieval, well-organized documents | Complex domains, interconnected data, reasoning tasks |
As mentioned above, GraphRAG is more complicated to build than ordinary RAG. It also needs special toolings. Let’s list the pros/ cons of GraphRAG.
Pros:
- Richer reasoning – the model can follow logical chains across multiple sources.
- Transparency – you can visualize the graph to see which passages contributed to each answer.
- Conflict detection – contradictory edges can be flagged before generation.
- Reusable knowledge – once built, the graph can serve many queries without re‑computing all relationships.
Cons:
- Complexity – you need extra steps: entity extraction, edge creation, and graph storage.
- Performance overhead – graph traversal and edge scoring add latency.
- Graph quality dependency – garbage‑in, garbage‑out; poor entity linking hurts results.
- Tooling requirements – you’ll typically need a graph library (e.g., NetworkX) and a persistence layer.
Use Cases
Imagine your’e using an employee support AI. You ask how many days of vacation do I get? From a ordinary RAG perspective, it can give the information about company policies for vacations, but it does not have an idea about you or the number of vacations you have already taken. However, a graph RAG can be setup to have all information about you getting you a more detailed answer with number of days of leaves allowed, how many days you have availed and so on.
- GraphRAG can be useful in Healthcare to link patient records (for e.g. a patient taking medication A showing a new symptom. Is there a case of other patients having the same symptoms after starting the same medication?
- Corporate Knowledge base: We have already quoted one example above. It can also be used for tracing things like what caused profitability to drop as this can need data from multiple areas.
- Investigative Journalism: This one is evident as journalists have to research multiple papers, court cases and have to trace between them.
- Customer Support Analytics: We may want to know what are the key issues that was faced by customers and is it related to a new part that is procured from a new vendor?
- Scientific Literature: This is similar to the investigative journalists where they have to go through multiple document. In this case the difference is instead of going through papers, scientists have to go through scientific paper, research findings and empirical theories.
This is just a few use cases where we can use GraphRAG. But GraphRAG isn’t really better, it is just more accurate in some kind of situations. In simple fact retrieval ordinary RAG is faster, cheaper and easier to maintain in the long run.
Let’s build an Example
Let’s build a dummy toy store DB. We will have different categories of toys, for example,
# Categories
categories = [
  ("cat_robotics", {"type": "Category", "name": "Robotics & Electronics"}),
  ("cat_building", {"type": "Category", "name": "Building Sets"}),
  ("cat_plush", {"type": "Category", "name": "Plush Toys"}),
  ("cat_puzzles", {"type": "Category", "name": "Puzzles"}),
]
Let’s add some products, brands and customers as well.
# Products
products = [
   ("robo_dog", {"type": "Product", "name": "Robot Dog", "price": 39.99,
                 "description": "A programmable robot dog that walks and barks."}),
   ("robo_dino", {"type": "Product", "name": "Happy Dino", "price": 42.99,
                  "description": "A programmable robot dinosaur that walks and roars."}),
   ("starblock_castle", {"type": "Product", "name": "StarBlock Castle Set", "price": 54.99,
                         "description": "A 500-piece interlocking brick castle building set."}),
   ("cuddle_bear", {"type": "Product", "name": "Cuddle Bear", "price": 19.99,
                    "description": "A soft plush teddy bear for toddlers."}),
   ("puzzle_planet", {"type": "Product", "name": "Puzzle Planet Set", "price": 14.99,
                      "description": "A 1000-piece jigsaw puzzle of the solar system."}),
   ("mini_drone", {"type": "Product", "name": "Mini Sky Drone", "price": 44.99,
                   "description": "A beginner-friendly remote control drone with camera."})
 ]

# Brands
brands = [
  ("brand_robotech", {"type": "Brand", "name": "Robo Technologies", "founded": 2011, "country": "USA"}),
  ("brand_starblock", {"type": "Brand", "name": "Star Blocks", "founded": 1998, "country": "Denmark"}),
  ("brand_snuggleworks", {"type": "Brand", "name": "Snuggle Works", "founded": 2005, "country": "USA"}),
]

# Customers
customers = [
  ("cust_amy", {"type": "Customer", "name": "Amy McKinzee", "age": 34}),
  ("cust_ben", {"type": "Customer", "name": "Ben Thompson", "age": 41}),
  ("cust_bella", {"type": "Customer", "name": "Bella Darling", "age": 24}),
]
Let’s add the relationship between them as JSON now.
# Relationships
edges = [
  # Product -> Category
  ("robo_dino", "cat_robotics", {"relation": "BELONGS_TO"}),
  ("mini_drone", "cat_robotics", {"relation": "BELONGS_TO"}),
  ("starblock_castle", "cat_building", {"relation": "BELONGS_TO"}),
  ("cuddle_bear", "cat_plush", {"relation": "BELONGS_TO"}),
  ("puzzle_planet", "cat_puzzles", {"relation": "BELONGS_TO"}),

  # Product -> Brand
  ("robo_dino", "brand_robotech", {"relation": "MADE_BY"}),
  ("mini_drone", "brand_robotech", {"relation": "MADE_BY"}),
  ("starblock_castle", "brand_starblock", {"relation": "MADE_BY"}),
  ("cuddle_bear", "brand_snuggleworks", {"relation": "MADE_BY"}),

  # Product <-> Product similarity
  ("robo_dino", "mini_drone", {"relation": "SIMILAR_TO"}),
  ("puzzle_planet", "starblock_castle", {"relation": "SIMILAR_TO"}),

  # Customer -> Product
  ("cust_amy", "robo_dino", {"relation": "PURCHASED"}),
  ("cust_ben", "puzzle_planet", {"relation": "PURCHASED"}),
  ("cust_bella", "puzzle_planet", {"relation": "PURCHASED"}),
  ("cust_ben", "starblock_castle", {"relation": "PURCHASED"}),
  ("cust_bella", "cuddle_bear", {"relation": "PURCHASED"}),
]
I defined JSON data for convenience for this demo, but under ideal situation, all of these will be contained in DB and fetched from there. We have the products that this toy store sells, categories assigned to them and a dummy information about customers who had purchased each of these products.
Next step is to define this as a directed graph. Let’s create that with NetworkX.
gph = nx.DiGraph()

# Add nodes to the graph
gph.add_nodes_from(products)
gph.add_nodes_from(categories)
gph.add_nodes_from(brands)
gph.add_nodes_from(customers)

# Add edges to the graph
for u, v, data in edges:
  gph.add_edge(u, v, **data)
Now that we have a directed graph, let’s understand what we are trying to achieve here. Following are steps that we are going to build,
- User asks a question. This can be anything.
- We will use a LLM model to extract the seed data. In this case seed data just means what nodes influences the response to this question.
- Next we will extract the relevant node as well formatted JSON for a model to be able to understand and analyze.
- Pass this information to a model along with the question for it to process and respond.
The difference here is that we are not relying on the vector distance for words but sending details that we have already determined is relevant to the query.
Step 1: Extract seed data
Now we need to figure out what nodes we are interested in based on the question. For this we will leverage a LLM model. I will just add the system prompt here. The code itself is just chat.completions call.
You are an excellent keyword extractor. You are given a question as follows:

  {question}

You also have a graph of nodes, each with a unique ID. Each node has a type, name and description. Format is as follows: [("node_id", {{"type": "NodeType", "name": "NodeName", "description": "NodeDescription"}}), ...]

  {nodes}

Identify which nodes are relevant to the question by matching keywords in the question with the node's name and description. You will return a list of node IDs that are relevant to the question. Your answer should be in the following format: ["node_id1", "node_id2", ...]

Do not include any additional text or explanation, only return the list of node IDs.
Question is the asked question that we want to answer. Nodes is created by NetworkX.
Let’s assume, user had asked the following question: What is the real name of the person who bought Happy Dino?
When we extract seed nodes for this, we get the following response.
Extracted seeds: ['robo_dino', 'cust_amy']
If you see our data, Happy Dino is a robot dinosaur that was purchased by Amy McKinzee. So, we do see the two seeds extracted are correct.
Step 2: Get text representation of Node data
Now that we know what nodes are relevant, the next step is to get the node data in a format that is understandable by the LLM which will form the final response. Remember in case of RAG, the documents are chunks of data (text/ markdown) that will be sent to the LLM for response. In this case we will be doing the same thing, but we have to extract the data from NetworkX for the seed nodes that we have found.
Let’s first get the nodes.
def retrieve_subgraph(self, G: nx.DiGraph, seed_nodes: list[str], hops: int = 1) -> nx.DiGraph:
  """Expand outward from seed nodes by `hops` steps, in either direction,
        to gather relevant surrounding context."""
  nodes_to_keep = set(seed_nodes)
  frontier = set(seed_nodes)
  undirected = G.to_undirected()

  for _ in range(hops):
    next_frontier = set()
    for node in frontier:
      next_frontier.update(undirected.neighbors(node))
      nodes_to_keep.update(next_frontier)
      frontier = next_frontier

  return G.subgraph(nodes_to_keep)

def subgraph_to_text(self, G: nx.DiGraph, sub: nx.DiGraph) -> str:
  """Turn the retrieved subgraph into a compact text block for the LLM."""
  lines = ["Entities:"]
  for node, data in sub.nodes(data=True):
    attrs = ", ".join(f"{k}={v}" for k, v in data.items() if k != "type")
    lines.append(f"  - [{data.get('type', '?')}] {node}: {attrs}")

  lines.append("\nRelationships:")
  for u, v, data in G.edges(data=True):
  	if u in sub.nodes and v in sub.nodes:
    	lines.append(f"  - {u} --{data.get('relation', 'RELATED_TO')}--> {v}")

  return "\n".join(lines)
The first method here will extract the JSON nodes for the seeds. In this case it returns all information that are related to cust_amy and robo_dino. To make thinks easier for the next LLM to process, we now create a text representation for the JSON. FInal output looks as follows.
Entities:
  - [Category] cat_robotics: name=Robotics & Electronics
  - [Customer] cust_amy: name=Amy McKinzee, age=34
  - [Brand] brand_robotech: name=Robo Technologies, founded=2011, country=USA
  - [Product] mini_drone: name=Mini Sky Drone, price=44.99, description=A beginner-friendly remote control drone with camera.
  - [Product] robo_dino: name=Happy Dino, price=42.99, description=A programmable robot dinosaur that walks and roars.

Relationships:
  - robo_dino --BELONGS_TO--> cat_robotics
  - robo_dino --MADE_BY--> brand_robotech
  - robo_dino --SIMILAR_TO--> mini_drone
  - mini_drone --BELONGS_TO--> cat_robotics
  - mini_drone --MADE_BY--> brand_robotech
  - cust_amy --PURCHASED--> robo_dino
Now that we have all relevant information, we will just need an LLM to process this information for the final answer.
Step 3: Get the final response
As the last step, we will need to just call an LLM to process the response. This is the prompt I used.
system_prompt = f"""
You are a knowledgeable assistant for a toy company. You have access to a graph of products, categories, brands, and customers as text.

  {graph_text}

Answer the following question based on the information in the graph. If the answer is not present, respond with "I don't know." Be concise and accurate. Do not assume anything. Double check before your final answer. If there is only one answer, provide it. If there are multiple answers, list them all.

  {question}
"""
Calling LLM with the prompt above returns me the following.
Answer: Amy McKinzee
Conclusion
So that’s the big picture for GraphRAG. While traditional RAG grabs relevant chunks and throws them to LLM, GraphRAG needs the data organized into a structured knowledge graph, then uses this graph for response. The tradeoff of course is that it requires a lot more upfront work – taking entities and relationships and building a graph structure. So, it is only used when data is interconnected, for simple retrieval using RAG is preferred.
The RAG landscape is evolving, and GraphRAG is a powerful tool in that toolkit. The question isn’t whether you should always use it—it’s whether your use case demands it. Hope you found this blog useful. Ciao for now!